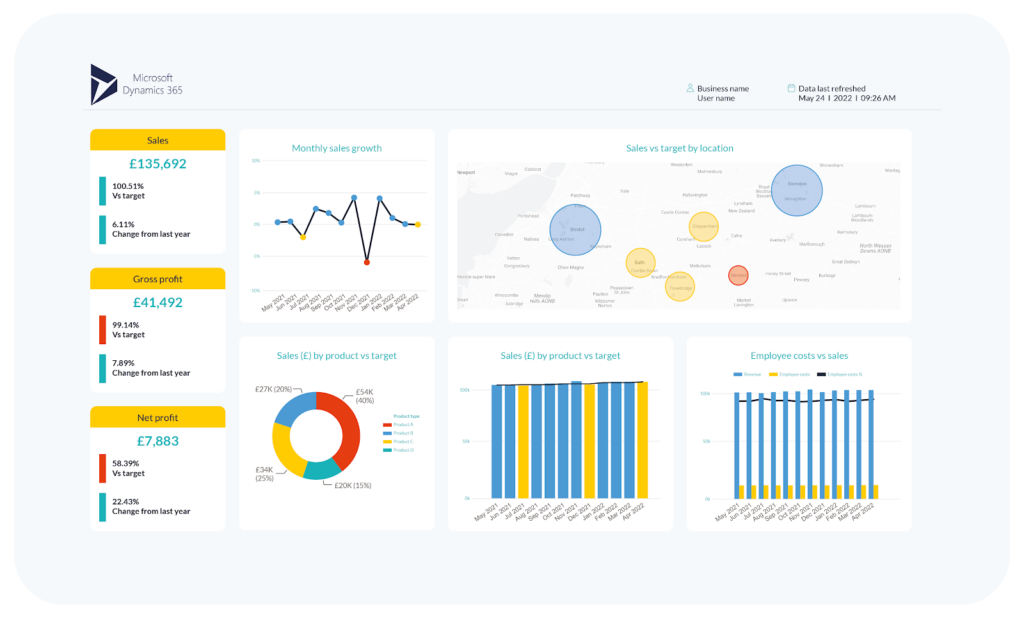
Data is the lifeblood of any business, but with so much information at your fingertips, it can be overwhelming to gain valuable insights. This is where Microsoft Power BI comes in.
Power BI is a powerful business intelligence (BI) tool that helps you transform your data into clear, understandable visuals. In this article, we’ll provide an introduction to Power BI, explaining what it is, how it works, and the key benefits it can offer your organisation.
Whether you’re a seasoned data analyst or just starting out, Power BI can empower you to make smarter data-driven decisions. Let’s dive in and see how Power BI can unlock the potential of your data!
What is Microsoft Power BI?
Microsoft Power BI is a suite of software services, applications, and connectors designed to transform your data into actionable insights. It goes beyond simply creating charts and graphs; Power BI empowers you to connect to a wide range of data sources, analyse and model your information, and generate interactive dashboards and reports.
Here’s a breakdown of Power BI’s key functionalities:
Data connectivity: Power BI boasts a vast library of connectors that allow you to effortlessly connect to various data sources. This includes popular cloud services like Salesforce and Google Analytics, on-premise databases, and even Excel spreadsheets.
Data transformation & modelling: Once your data is connected, Power BI allows you to clean, transform, and organise it for optimal analysis. You can create relationships between different datasets, ensuring consistency and enabling deeper exploration.

Interactive visualisations: Power BI excels at creating visually appealing and informative reports and dashboards. It offers a wide range of charts, graphs, and other visual elements you can customise to effectively communicate your data insights.
Collaboration & sharing: Power BI fosters collaboration by allowing you to share your reports and dashboards with colleagues securely. You can control access levels and ensure everyone is on the same page with the latest data insights.
Mobile accessibility: Access your data and reports anytime, anywhere with Power BI’s mobile apps. This empowers you to stay informed and make data-driven decisions on the go.
Power BI bridges the gap between your raw data and actionable business intelligence. It simplifies the process of data analysis, visualisation, and communication, allowing businesses to gain a clear understanding of their performance and make informed decisions for future success.
Essentially, Power BI is an interactive reporting platform that gives you the right answers, quickly, so you can make smart business decisions.
What’s included in Microsoft Power BI?
Power BI isn’t a single software program, but rather a suite of tools that work together seamlessly. Here’s a breakdown of the main components included in Microsoft Power BI:
Power BI Desktop
This is a free desktop application that serves as the foundation for working with your data. Here you can connect to data sources, transform and model your data, create reports and visualisations, and collaborate with others.
Power BI Service (SaaS)
This cloud-based service allows you to publish and share your reports and dashboards created in Power BI Desktop. Users with access can view and interact with the reports online, eliminating the need for individual installations.
Power BI Mobile Apps
Free mobile apps for iOS, Android, and Windows devices provide on-the-go access to your Power BI reports and dashboards. This allows you to stay informed and make data-driven decisions wherever you are.
Power Query
This built-in tool within Power BI Desktop facilitates data connection and transformation. You can use Power Query to import data from various sources, clean and filter it, and shape it for analysis.
Power Pivot
Another feature within Power BI Desktop, Power Pivot empowers you to create data models. This involves establishing relationships between different datasets, allowing for more complex analysis and deeper insights.
Power View & other visualisation tools
Power BI offers a range of tools for creating interactive and visually compelling reports and dashboards. Power View, specifically, allows you to design custom visualisations that go beyond traditional charts and graphs.
Other tools provide options for maps, funnels, and various other visual elements to effectively communicate your data story.
Power Q&A
This natural language query feature allows users to ask questions about their data in plain English. Power BI will then analyse the data and provide relevant insights, making it easier for non-technical users to explore the information.
These are the core components included in Microsoft Power BI. Additionally, there are features like Power BI Report Server for on-premises deployments and Power BI Embedded for integrating analytics into other applications.
But why should you consider Power BI? And what does data visualisation actually do?
Even with a powerful tool like Power BI at your disposal, you might wonder why data visualisation matters and how it can benefit your organisation. Here’s why Power BI is a strong contender for your business intelligence needs:
Uncover hidden insights
Raw data can be overwhelming and difficult to interpret. Power BI’s data visualisation tools transform numbers into charts, graphs, and other visual elements.
This allows you to see patterns, trends, and relationships that might be missed in spreadsheets or tables. By uncovering these hidden insights, you can gain a deeper understanding of your business performance, customer behaviour, and market trends.
For example, imagine being able to combine:
- Sales data from Dynamics 365 or Sales Force with…
- Financial records from Xero or QuickBooks
- Formulas from Excel or Google Sheets and use third-party data in…
- SQL Server or AWS or from the company’s website
Improved communication & collaboration
Data visualisations are a universal language. Compelling charts and graphs can effectively communicate complex information to a wider audience, even those without a strong technical background. Power BI’s collaborative features allow you to share reports and dashboards with colleagues, fostering discussions and better decision-making across departments.
Data-informed decision making
Businesses need to make informed choices based on accurate information. Power BI empowers you to move beyond intuition and gut feelings. By visualising your data, you can identify opportunities, address challenges, and make strategic decisions backed by concrete evidence.
Increased efficiency and productivity
Struggling to find the information you need in endless spreadsheets and reports? We can waste hours, days, weeks taking information from different sources and putting it into spreadsheets. Power BI can automate it all, streamline the process, and remove human error. With interactive dashboards and reports, you can access and analyse your data quickly and efficiently, saving valuable time and resources.
Improved ROI
Data is an asset, but only if you can leverage it effectively. Power BI helps you unlock the value of your data, leading to better decision-making, improved performance, and ultimately, a higher return on investment.
Reliably visualise business KPIs
Key Performance Indicators (KPIs) are the metrics that define your business success. Power BI excels at creating clear and consistent visualisations of your most important KPIs. This allows you to track progress towards goals, identify areas for improvement, and ensure everyone in your organisation is working towards the same objectives.
With Power BI, you can:
- Find insights
- Uncover hidden value that can be…
- Shared with specific people to…
- Make solid decisions…
- So that everyone can do their job better
Power BI dashboards, if done correctly, will help you understand what’s working and what’s failing AND help you to decide what to do next.
It’s not just about pretty graphs and charts. So, if you don’t use Power BI yourself, or if you’ve only skimmed the surface, you might think it’s just a way to present your business information in pretty graphs and charts. It’s not!
Our favourite features in Power BI
Now that we’ve explored the core functionalities of Power BI and the value it brings to data analysis, let’s delve deeper. Power BI boasts a range of features designed to streamline the process of working with your data and extracting valuable insights.
In this section, we’ll explore some of the most useful features that make Power BI such a powerful business intelligence tool.
Personalisation
Pin vital statistics from several reports onto a single dashboard, so you have everything you need in one, single view. And your colleagues can do the same! Everyone can choose what’s most relevant to them, so everyone stays focussed.
Interactive filters and drill-downs
Filter information to your heart’s content to see your business from different angles and then drill into the data for more revealing insights
Q&A(i)
We’ve mentioned this one already, but it’s so good we’re going to mention it again! Ask questions in plain English and powerful AI (Artificial Intelligence) can give you the answers – fast!
But Power BI is just a tool; success lies in the execution
Getting the most from Power BI requires quality thinking, a good understanding of what you need to KNOW, a plan for the data and the technical skills to put it all into practice.
Explore your ideas with Mintivo., we’re here to help
Book a consultation with a Power BI expert here at Mintivo. Let’s explore how we can implement Power BI in your business, to influence your organisation in new and unexpected ways.


